Participants in the ELFA MLFI-25:
- ADP Credit
- BancorpSouth Equipment Finance
- Bank of America
- Bank of the West
- BB&T Bank
- BMO Harris Equipment Finance Company
- Canon Financial Services
- Caterpillar Financial Services
- CIT
- De Lage Landen Financial Services
- Dell Financial Services
- EverBank Commercial Finance
- Fifth Third Equipment Finance Company
- First American Equipment Finance
- GreatAmerica
- Hitachi Credit America
- HP Financial Services
- Huntington Equipment Finance
- John Deere Financial
- Key Equipment Finance
- M&T Bank
- Marlin Leasing
- Merchants Capital
- PNC Equipment Finance
- RBS Asset Finance
- SG Equipment Finance
- Siemens Financial Services
- Stearns Bank
- Suntrust
- Susquehanna Commercial Finance
- US Bancorp Equipment Finance
- Verizon Capital
- Volvo Financial Services
- Wells Fargo Equipment Finance
The Equipment Leasing and Finance Association's (ELFA) Monthly Leasing and Finance Index (MLFI-25), which reports economic activity for the $628 billion equipment finance sector, showed overall new business volume for March was $6.8 billion, up 10 percent from volume of $6.2 billion in the same period in 2011. Volume was up 36 percent from the previous month. Year-to-date cumulative new business volume is up 17 percent.
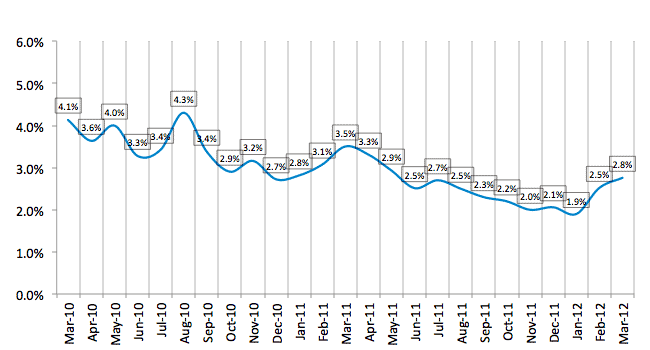
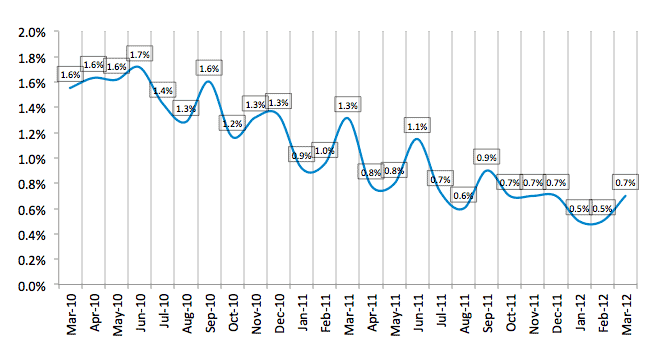
Receivables over 30 days increased to 2.8 percent in March, up from 2.5 percent in February, and down by 20 percent compared to the same period in 2011. Charge-offs increased to 0.7 percent, up from 0.5 percent the previous month, and down by 46 percent compared to the same period last year.
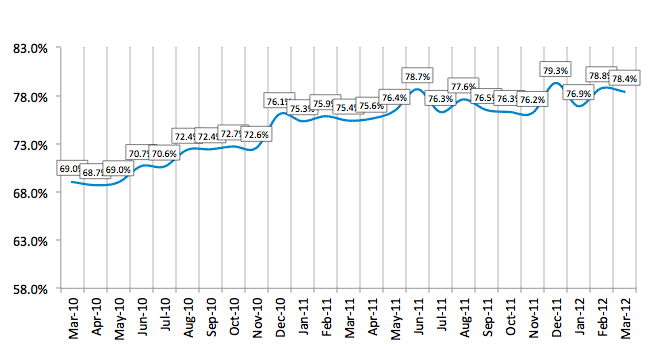
Credit approvals dipped slightly to 78 percent in March from 79 percent in February. More than 66 percent of participating organizations reported submitting more transactions for approval during March, up from 62 percent in February.
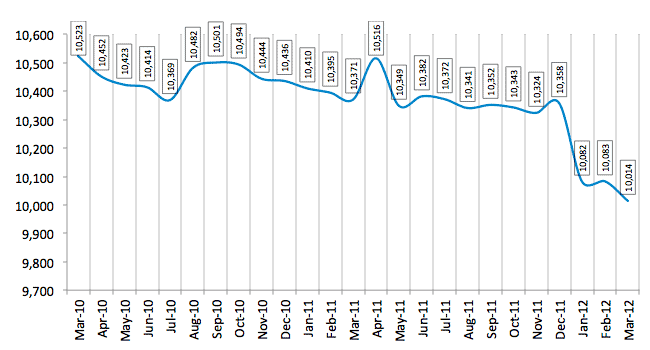
Finally, total headcount for equipment finance companies in March decreased 0.7 percent from the previous month, and was down 3.4 percent year over year. Supplemental data show that the construction and trucking industries continued to lead the underperforming sectors.
Separately, the Equipment Leasing & Finance Foundation's Monthly Confidence Index (MCI-EFI) for April is 62.1, up slightly from the March index of 61.7, and the fourth consecutive month of increases, indicating industry participants' optimism is slowly but steadily rising. For more detailed information on the MCI-EFI visit www.LeaseFoundation.org
ELFA President and CEO William G. Sutton, CAE, said: "Growth in new business volume appears to be easing somewhat as we head into the summer months. Increases in originations of the magnitude we have experienced during the past two to three years in a recovery mode are probably not sustainable. Nevertheless, a 10 percent rate of growth for the period continues a positive trend by businesses to make capex investments in productive assets. Credit quality metrics appear to be stabilizing, returning to pre-recession levels."
John McQueen, Executive Vice President and Head of Wells Fargo Equipment Finance, headquartered in Minneapolis, MN, said, "We started to see a positive change in the equipment finance market in Q4-2010 with increased demand and reduced portfolio delinquency. In my perspective, demand for new equipment was being driven by a combination of factors. These factors include the replacement cycle for older equipment that businesses had been using for longer periods due to a weakening economy as well as companies focusing on acquiring equipment to improve efficiency. As we enter 2012, we've seen a continuation of these trends as Wells Fargo Equipment Finance had record financial performance in 2011, and we continued this momentum during Q1 with 11.5% year-over-year volume growth, a 17.0% backlog increase, strong transaction spreads, and continued portfolio quality improvement."
MLFI-25 New Business Volume
(Year Over Year Comparison)

:: TOP 
Aging of Receivables Over 30 Days:
:: TOP
Average Losses (Charge-offs) as a % of net receivables
(Year Over Year Comparison)
:: TOP
Credit Approval Ratios As % of all Decisions Submitted
(Year Over Year Comparison)
:: TOP
Total Number of Employees
(Year Over Year Comparison)
:: TOP